Developing Projects for ESP32 Devices with Visual Studio
This tutorial shows how to develop projects for the Espressif ESP32 chip using Visual Studio, VisualGDB and the new ESP-IDF framework.
Warning: The MSBuild-based ESP32 projects are deprecated since VisualGDB 5.4. Please use the Advanced ESP-IDF Project Subsystem instead. The rest of the steps shown in this tutorial will still work.
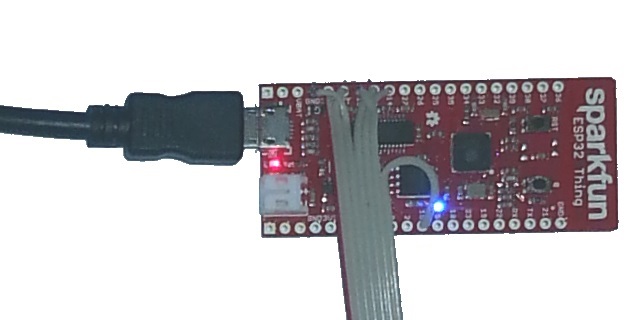
We will show how to build, program and debug a basic ESP32 program over JTAG on the Sparkfun ESP32 Thing board. In order to use JTAG with ESP32 you will need to connect the following pins to your JTAG programmer:
| Pin name on ESP32 chip | Signal on ESP32 Thing board | Pin on the ESP32 board | JTAG signal | Pin on JTAG20 cable |
| +3.3V | +3.3V | 5 on J1 | +3.3V | 1 |
| Reset | CHIP_PU | 6 on J1 | SRST | 3 |
| GND | GND | 1 on J1 | GND | 4 |
| MTDI | 12 | 8 on J1 | TDI | 5 |
| MTMS | 14 | 9 on J1 | TMS | 7 |
| MTCK | 13 | 7 on J1 | TCK | 9 |
| MTDO | 15 | 11 on J2 | TDO | 13 |
If you are using a different ESP32 board, consult your board schematics to find the pin numbers corresponding to the signals listed above.
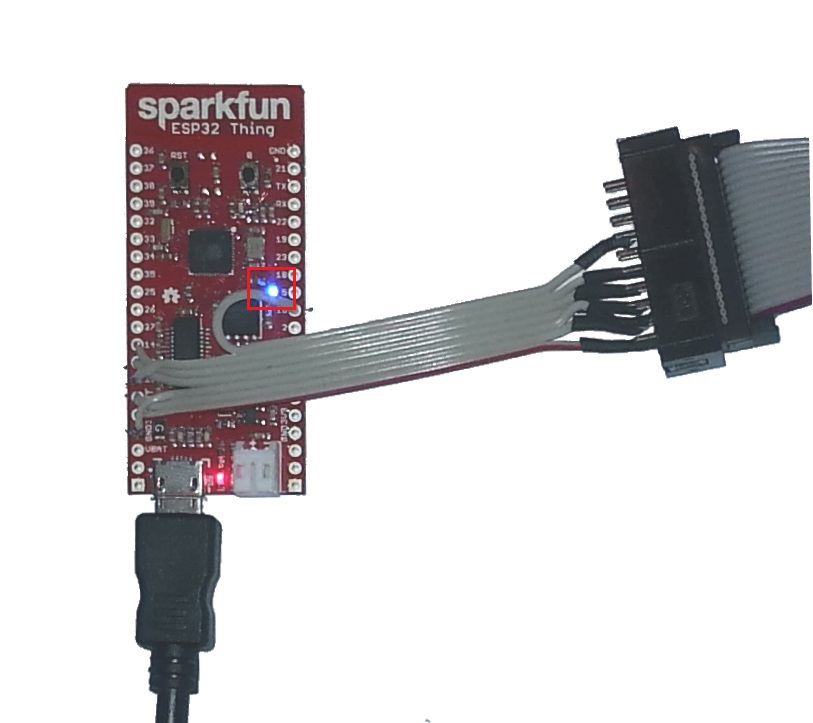
The assembled JTAG debugging setup for the ESP32 Thing board looks as follows: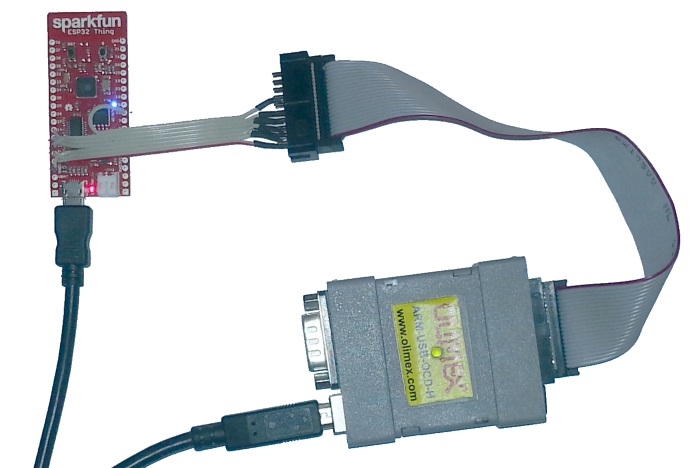
Before you begin, install VisualGDB 5.2 or later.
Note: VisualGDB 5.4 supports the new advanced ESP-IDF project subsystem that delivers better development experience than MSBuild-projects shown in this tutorial. Once you get basic debugging to work, follow this tutorial to get started with the new advanced ESP-IDF project subsystem.
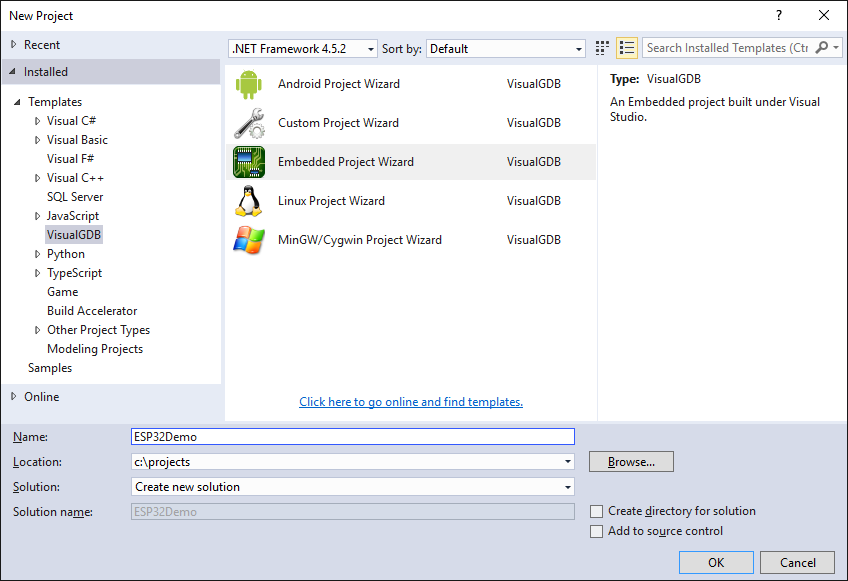
- Start Visual Studio and open the VisualGDB Embedded Project Wizard:
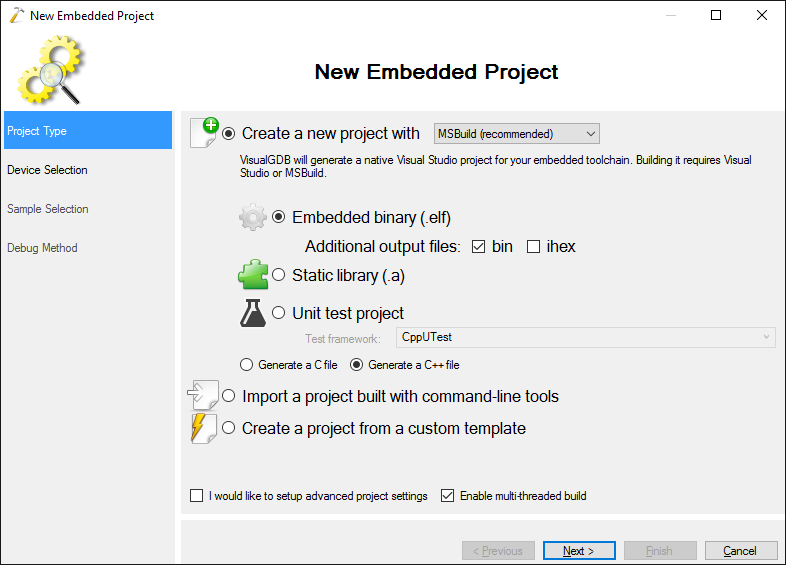
- On the first page proceed with the default MSBuild subsystem and click “next”:
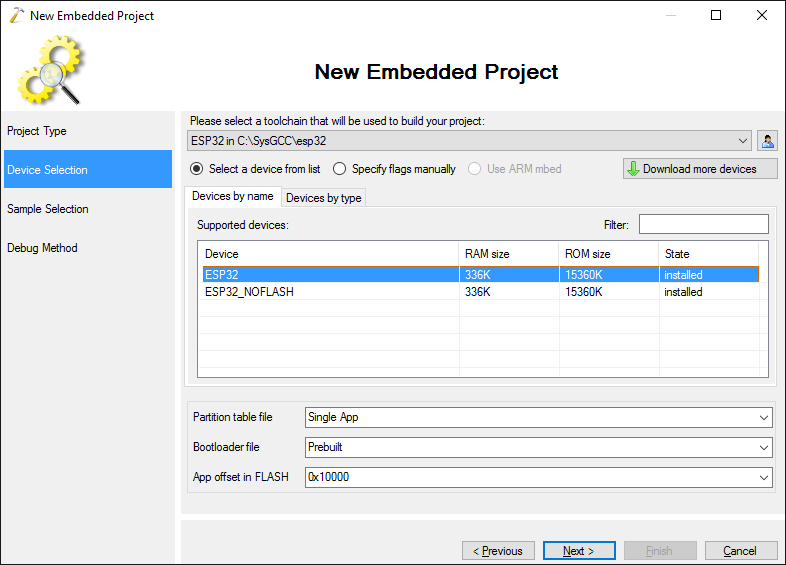
- On the next page select the ESP32 toolchain. If it is not installed, VisualGDB will download and install it automatically. If it is not shown in the wizard, install it via Tools->VisualGDB Package Manager. Then select the regular ESP32 device:
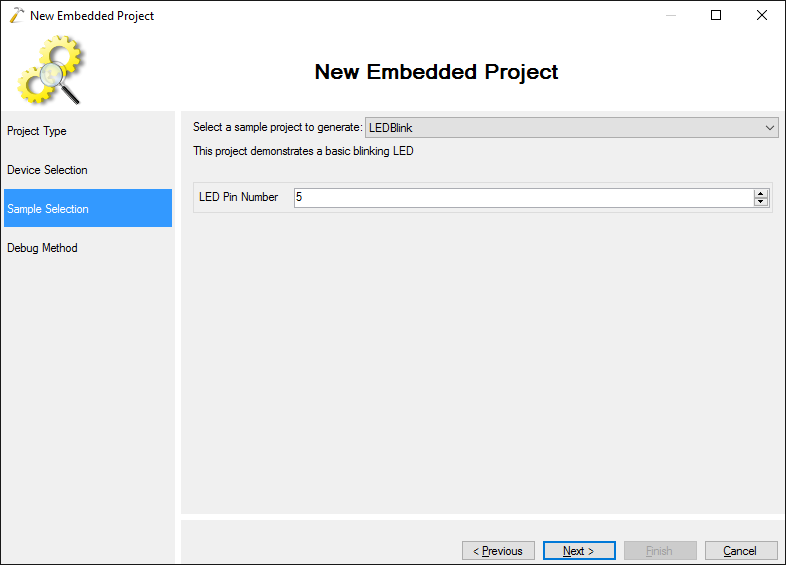
- On the Sample Selection page pick the LEDBlink sample and enter the pin number where your LED is connected. On the Sparkfun ESP32 Thing board used in this tutorial the LED is connected to pin #5:
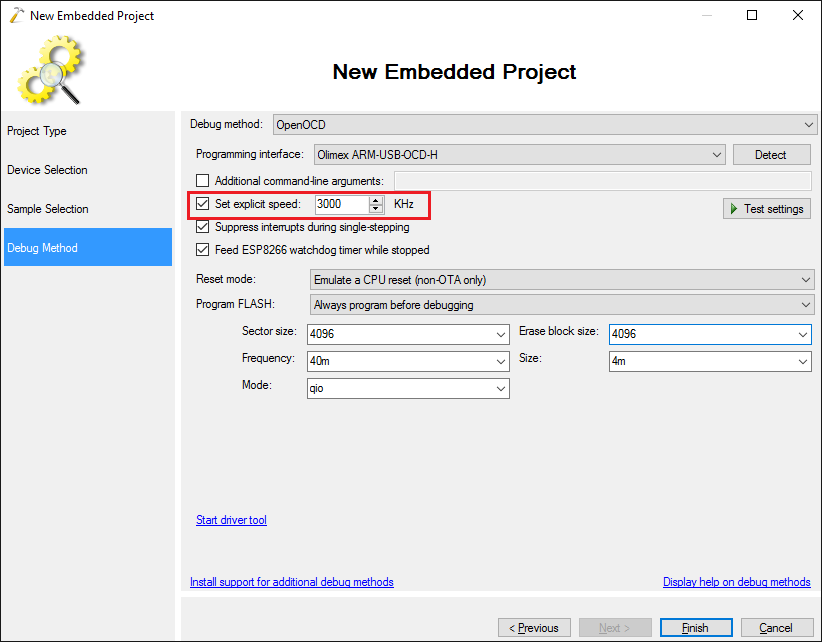
- On the debug settings page select your JTAG programmer. For Olimex ARM-USB-OCD-H and other FT2232-based ones, enable the “explicit speed” checkbox:
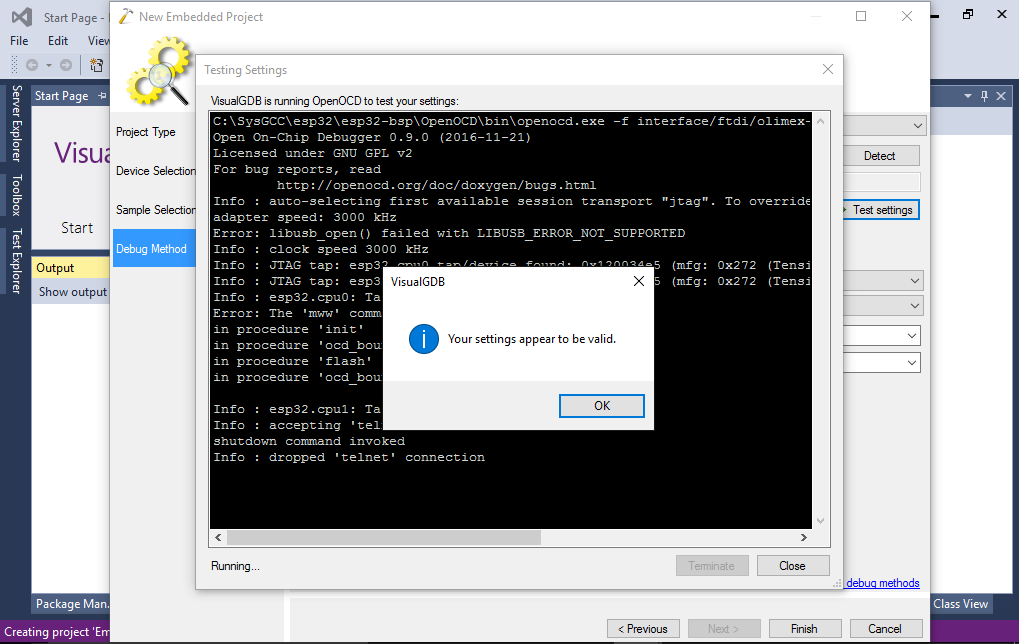
- You can test the OpenOCD settings and check for common driver problems by pressing the “Test settings” button:
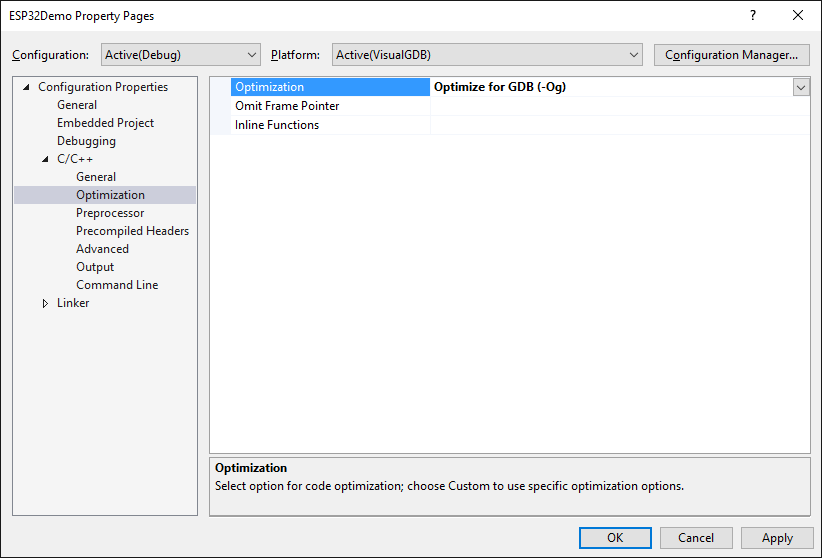
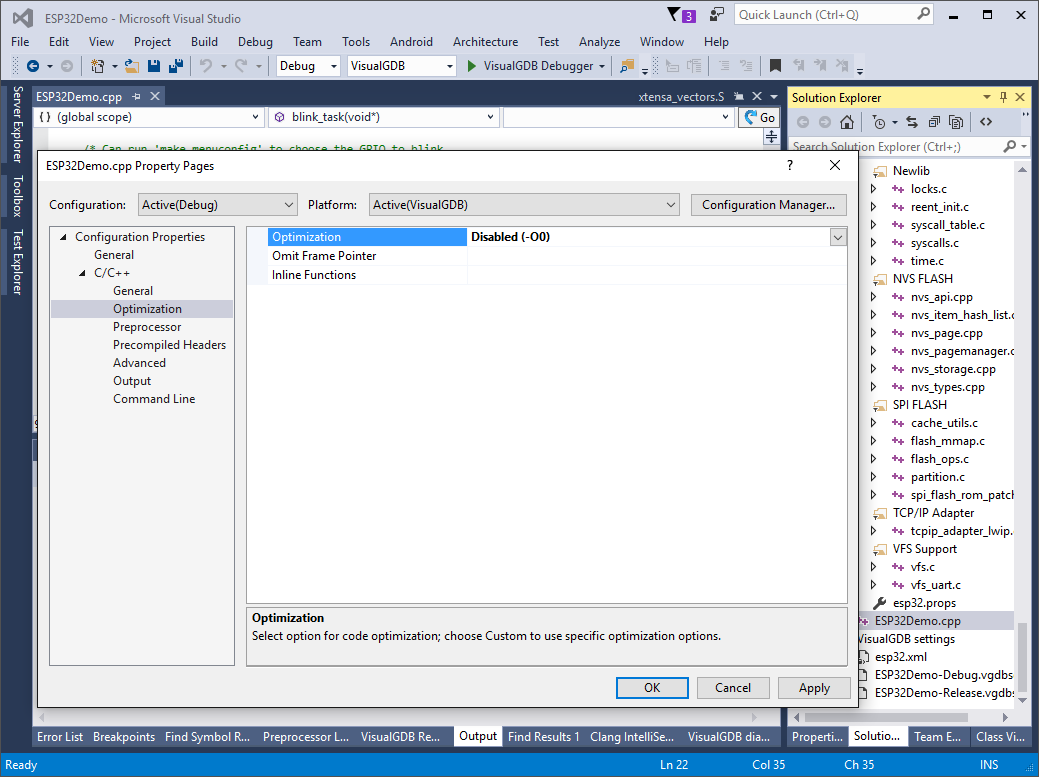
- Press “Finish” to generate your project. Due to a bug in the ESP-IDF framework, the projects built with no optimization (which is the default option for the debug configuration) will not work properly. To fix this, open Visual Studio Project Properties and change the optimization for the project to “Optimize for GDB (-Og)”. If you are using an older version of VisualGDB that does not show this option, simply enter -Og in the “Optimization” field:
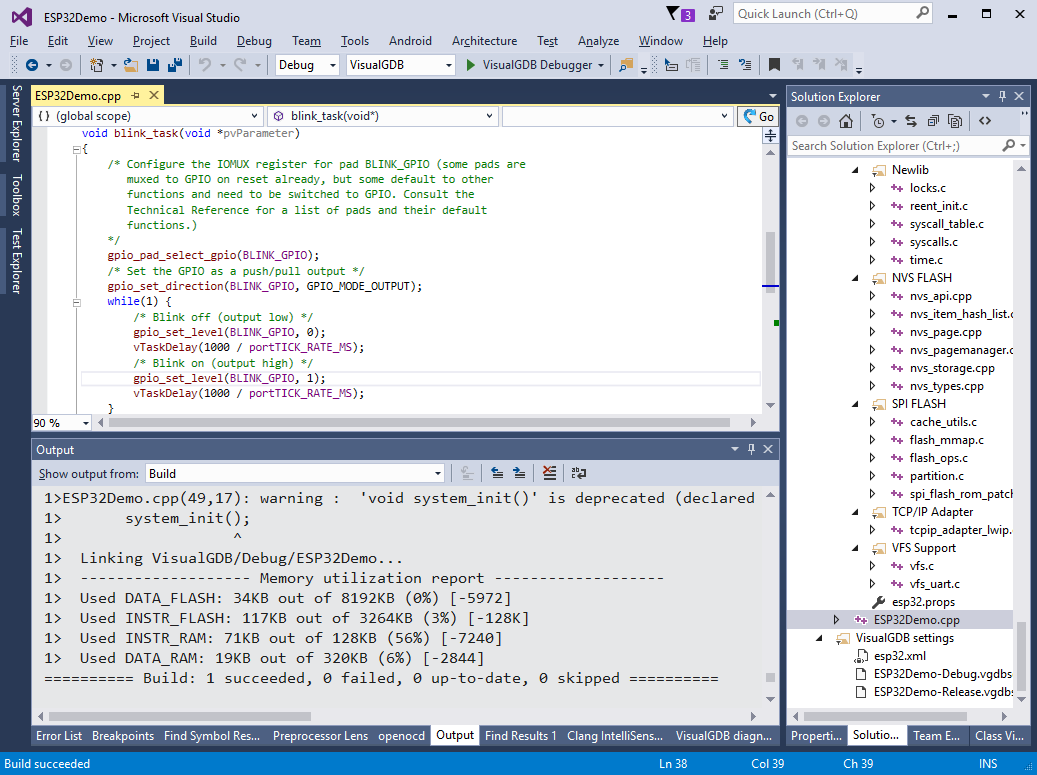
- Build your project via Ctrl-Shift-B:
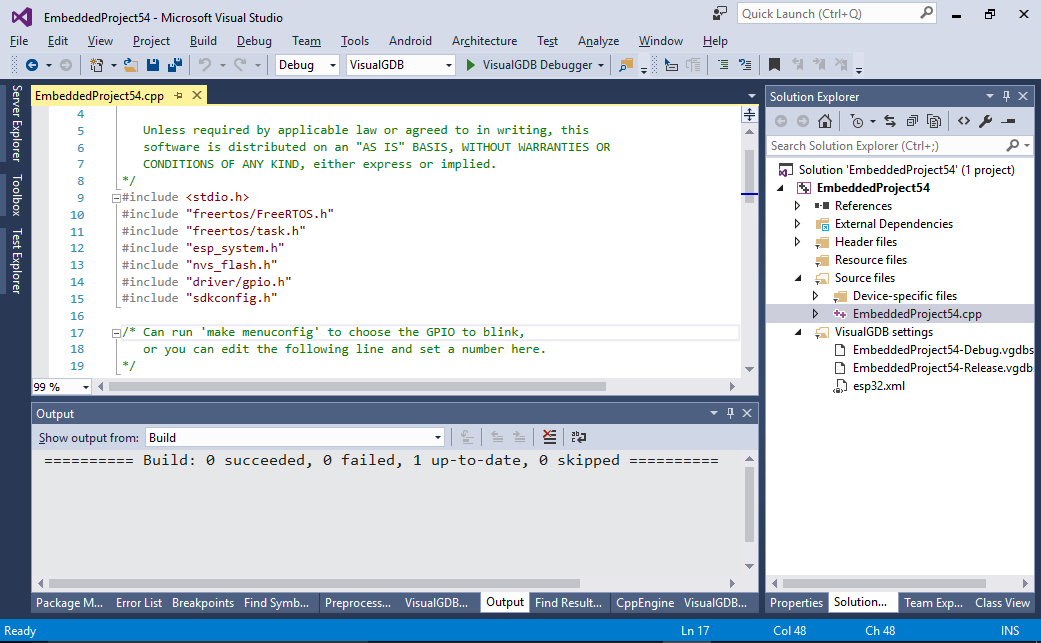
- Try building the project again and ensure it is shown as “up to date”:
 If you have installed the latest Cygwin-based toolchain and are using VisualGDB 5.2 or earlier, VisualGDB will not handle the project dependencies correctly and will try building all of the source files again. If this happens, open VisualGDB Project Properties, go to the Path Mapping page and set GDB Path Style to Cygwin and the Windows directory for absolute paths to your toolchain directory:
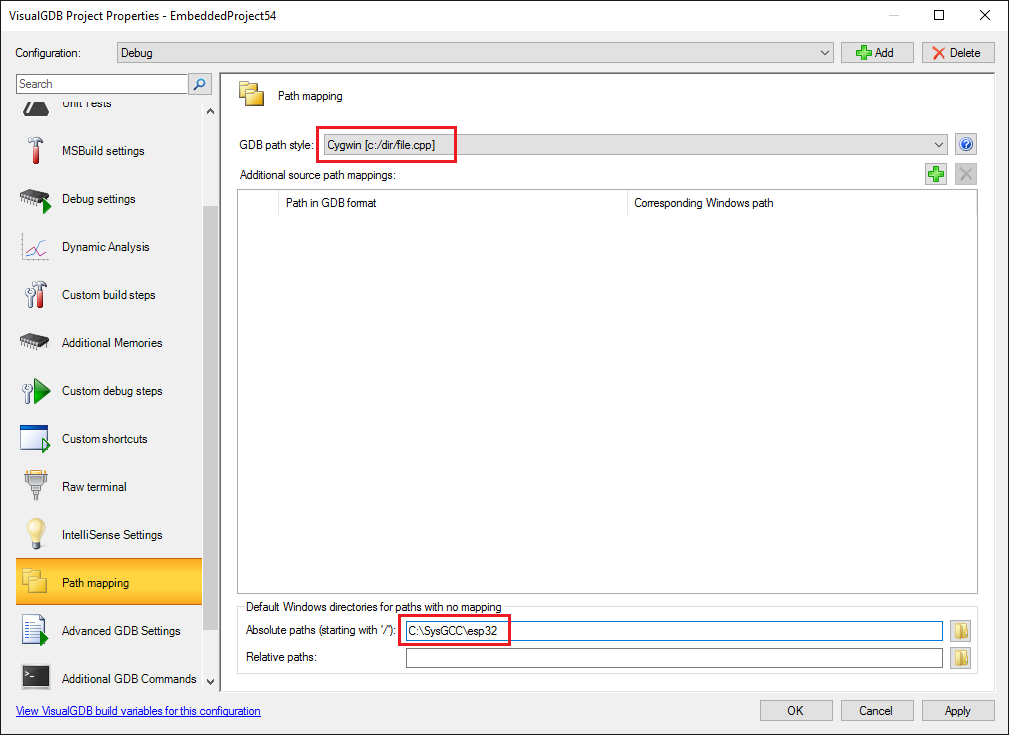
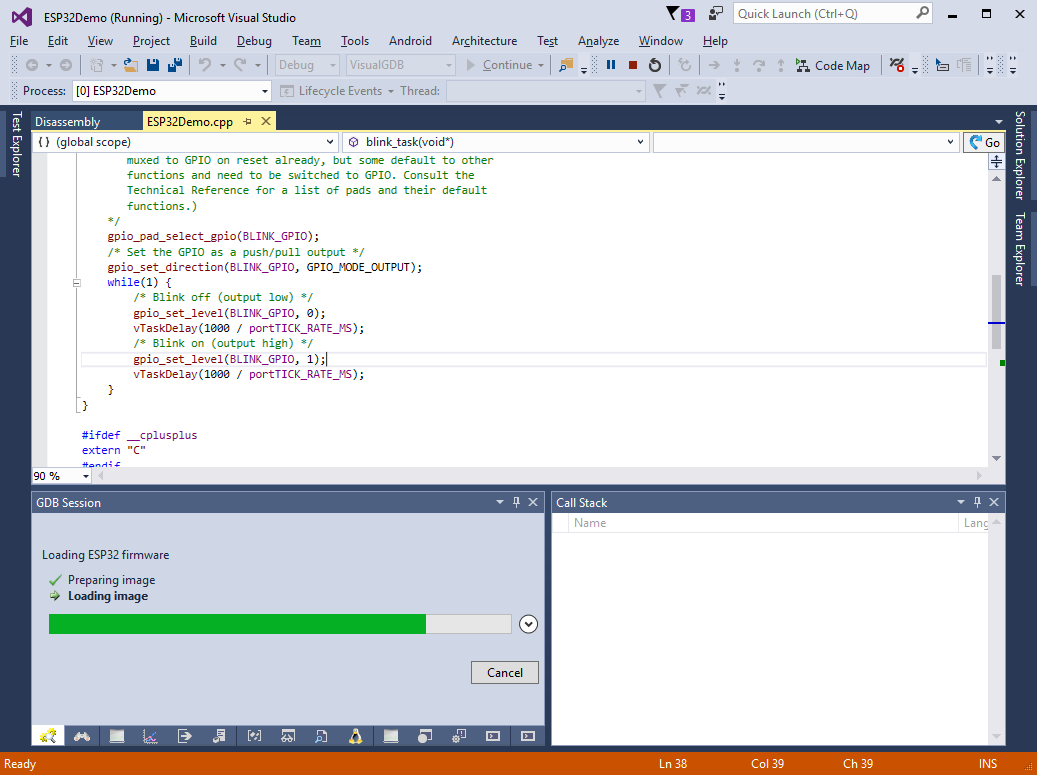
- Press F5 to start debugging. VisualGDB will automatically program the FLASH memory on the device:
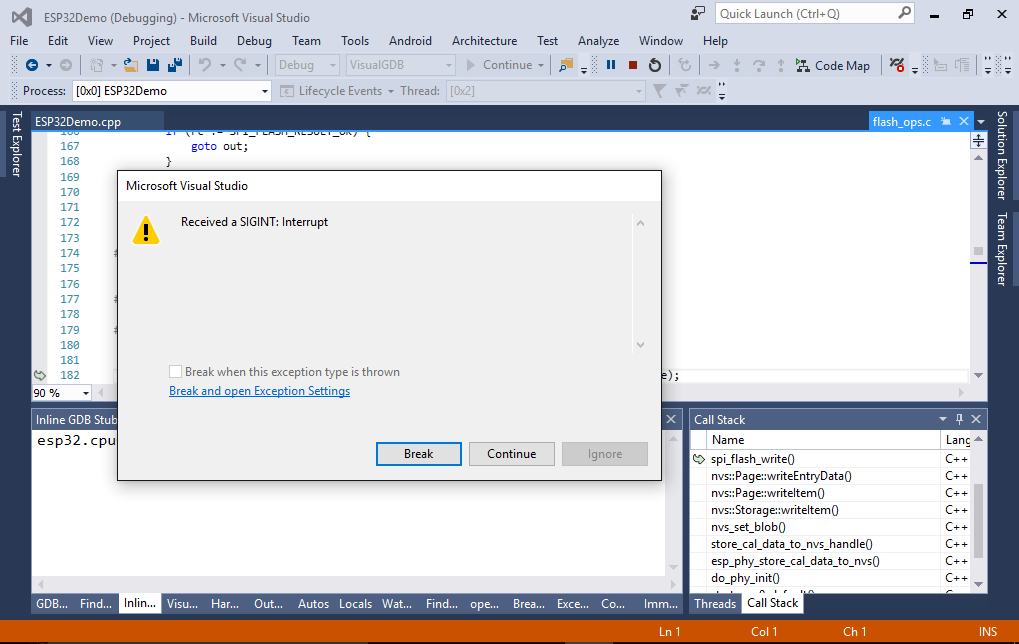
- After programming the program may produce a stop event in a random location inside the ESP32 libraries. You can safely ignore it by pressing “Continue”:
WARNING! If you are using ESP-IDF 2.0, the bootloader may randomly hang after a software reset. If this happens, remove all breakpoints, press the Reset button on the board, resume the program and set your breakpoints again. - Once the programming is complete, the onboard LED should start blinking:
- Set a breakpoint somewhere in the blink_task() function and wait for it to trigger:
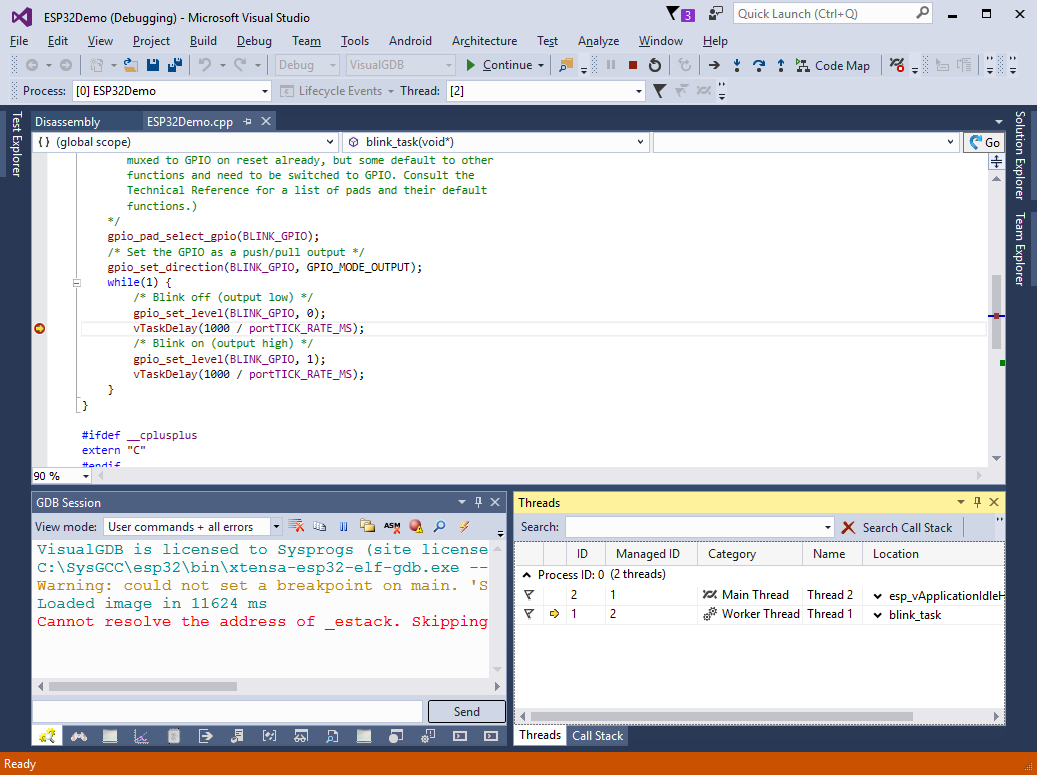
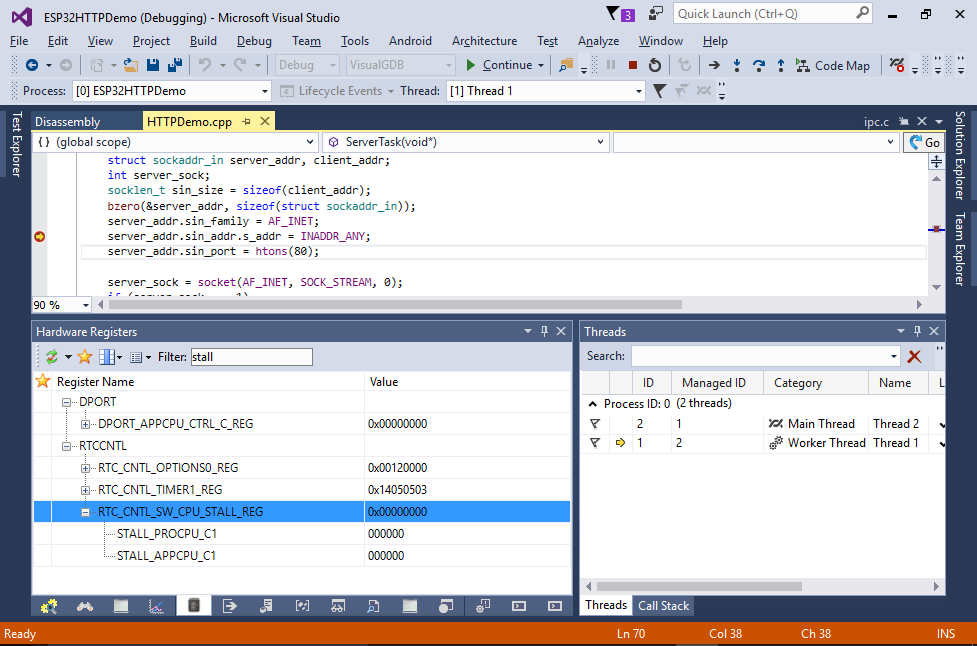
- Note how the 2 ESP32 cores got mapped to 2 threads in the VisualGDB threads window:
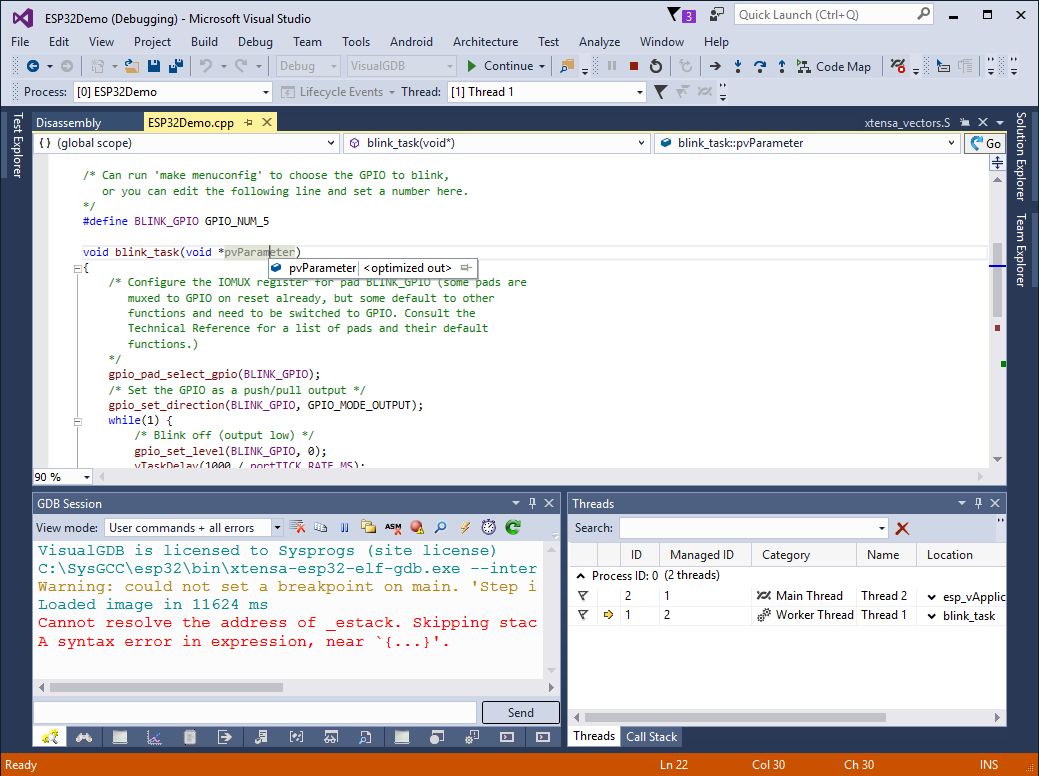
- Because we have enabled minimum optimizations, the unused variables will not be shown and stepping through code will sometimes look strange. You can fix this by disabling optimization for specific files that you want to debug. This will not break the ESP-IDF framework and will provide better debugging experience:
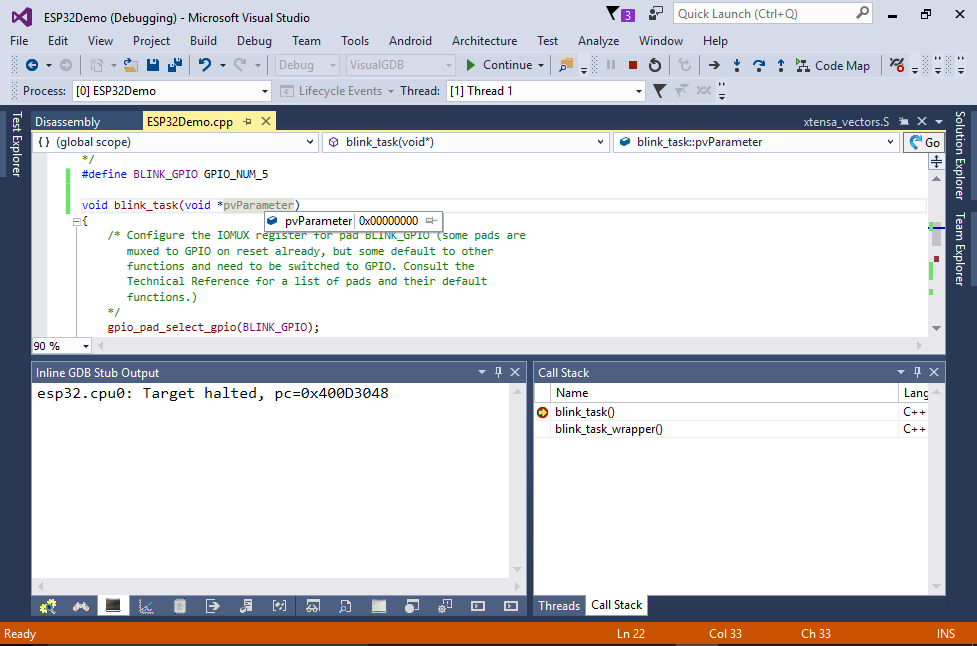
- Another limitation of the ESP32 debugger is the inability to read local variables for the top-level functions. If you encounter this problem, while debugging your thread functions, simply wrap it with another function:
void blink_task_wrapper(void *pvParameter)
{
    blink_task(pvParameter);
}
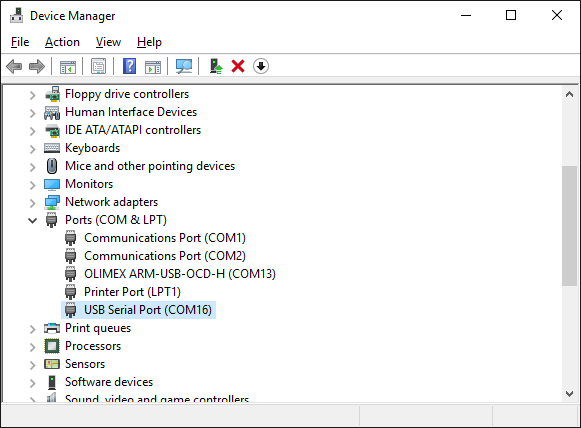
- The ESP32 framework outputs a lot of debugging information to the COM port. On the Sparkfun ESP32 Thing board the COM port is connected to an on-board USB-to-COM converter. Use the Device Manager to find out its port number:
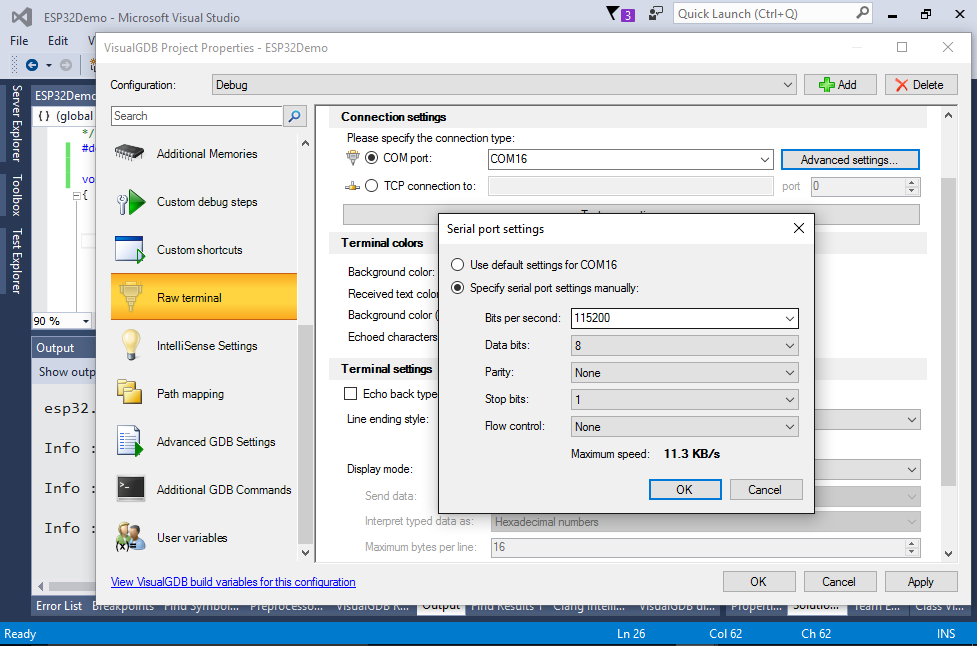
- Then open VisualGDB Project Properties and enable the Raw Terminal on that COM port:
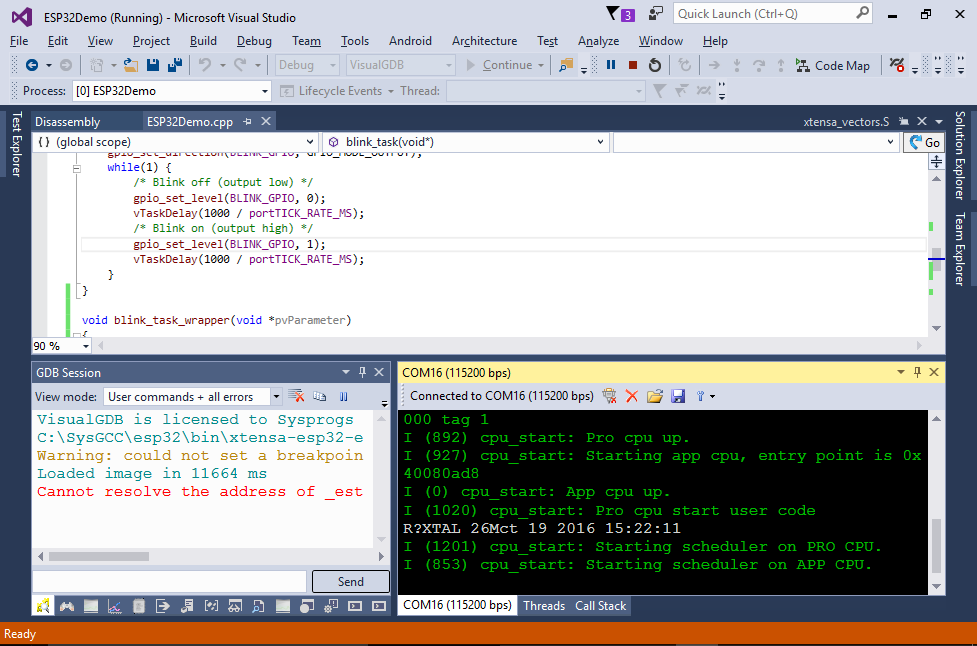
- Next time you start debugging, VisualGDB will connect to the selected COM port and show various debug information printed by the ESP32 chip:
- The ESP32 toolchain comes with peripheral register definitions derived from the ESP32 header files. You can view them via the Debug->Windows->Hardware Registers command in Visual Studio:


Note that the ESP32 tools have several known limitations that may interfere with debugging. Please refer to this post for a list of known issues and workarounds. We also recommend trying out the new ESP-IDF project subsystem that provides a better development experience for ESP32 projects compared to MSBuild.